


So I had been battling many mask leaks with my Quattro Air, but for little over a week now I haven't been waking up with leaks as much. But when I look at sleepyhead and resccan my leak graph looks crazy, but my median score is about 15.4, which means half time I am below this Mark and half time I am above this Mark. My 95% is a fluctuation between 38.6 and 58.9, All the posts I read tell me that I spend most of my sleep at or below that Mark, but doesn't that also mean that 5% of the time I am at or above that Mark. Meaning that in an eight hour night my machine takes 480 readings one per minute actually I think it takes 2880 readings one per second. So let's stay with the 480 readings, because it's scored on L/min. So for an average 8hr night I have 24 readings at or above 38.6 and I have 456 readings below that Mark. Also, because my median is 15.4, that means I have 240 marks below that Mark, so now I have 216 between 15.4 and 38.6, which means that 45% I spend somewhere around 27L/min. That being the median between my true median and my 95%. Now all this being said I spend roughly 75% of my time slightly above the large leak limit for my machine and below it. So would you understand that my leaks are under control or should I look for a new ffm? Or its everyone now confused and want to shoot me?
Also if I look at the little smiley face on my info screen when I wake up if it's happy and green that means I spent 70% below the large leak plateau combine all this information out means I had a good leak night, but if it is unhappy and red that doesn't mean I had s bad night just means my leaks were too big to compensate for but probably not too big to wake me Orr Dustin my sleep. Am I just putting to much into this? I have a mathematical mind and it wants to understand this information. From my understanding the key is the smiley face on the info screen
mask leaks and trying to understand mine
mask leaks and trying to understand mine
_________________
| Mask: Quattro™ Air Full Face Mask with Headgear |
| Humidifier: S9™ Series H5i™ Heated Humidifier with Climate Control |
| Additional Comments: apap 12-20 cm ; humidity 75° I have resscan 4.3 and sleepyhead |
Last edited by neallo on Wed Jan 22, 2014 1:47 pm, edited 1 time in total.

Re: mask leaks and trying to understand mine
This one.... Your math got me totally confused. I have no idea what your leak line graph might look like based on all those various data point things.neallo wrote:everyone now confused and want to shoot me?
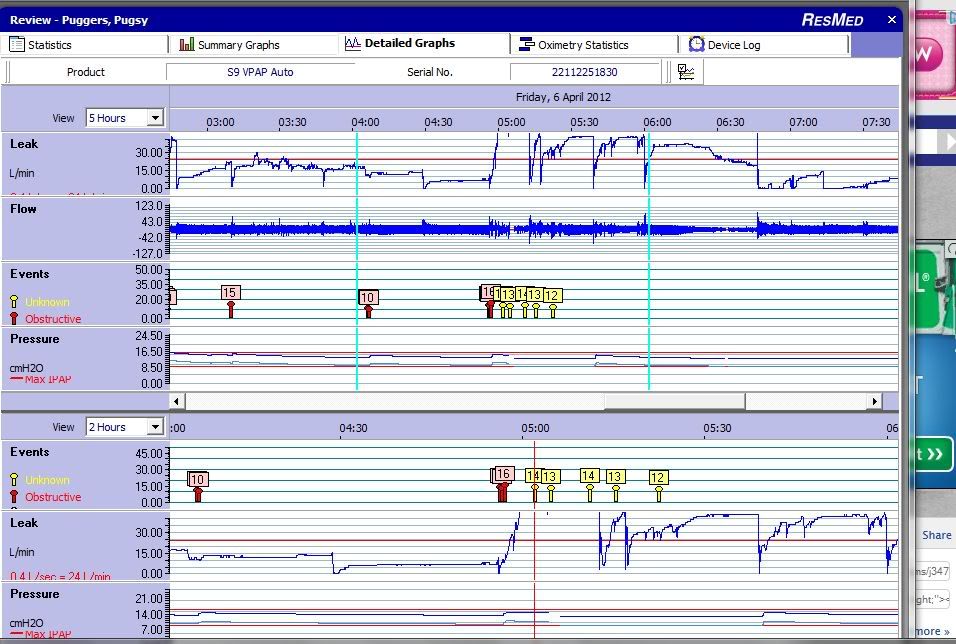
Assuming leaks don't wake a person up.....just look at ResScan and approximate how much time you actually see the leak line above the red line at 24 L/min.
Does it look like this? As ugly as this one was I still didn't get Mr Frowny face for large leaks more than 30% of the night...I was close though.
Personally, my thoughts....it depends on how far above 24 L/Min and how long it stays above 24 L/min. A couple of 15 minute blocks of time spent at 28 L/min isn't the end of the world. An hour or two up around 35 L/min...not good.
_________________
| Machine: AirCurve™ 10 VAuto BiLevel Machine with HumidAir™ Heated Humidifier |
| Additional Comments: Mask Bleep Eclipse https://bleepsleep.com/the-eclipse/ |
I may have to RISE but I refuse to SHINE.
If you want to try the Eclipse mask and want a special promo code to get a little off the price...send me a private message.
If you want to try the Eclipse mask and want a special promo code to get a little off the price...send me a private message.

Re: mask leaks and trying to understand mine
Curious...How many years have you been using that software? You seem pretty in touch with things.
I understand that success at this requires self involvement, but am I supposed to get this much into these graphs and results? Just a newbie here. (Waiting for my first machine).
I understand that success at this requires self involvement, but am I supposed to get this much into these graphs and results? Just a newbie here. (Waiting for my first machine).
_________________
| Mask: Quattro™ Air Full Face Mask with Headgear |
| Humidifier: S9™ Series H5i™ Heated Humidifier with Climate Control |
Re: mask leaks and trying to understand mine
You asking me? I will have my 5 year cpap anniversary come this May.Mkatz27 wrote:Curious...How many years have you been using that software? You seem pretty in touch with things.
I understand that success at this requires self involvement, but am I supposed to get this much into these graphs and results? Just a newbie here. (Waiting for my first machine).
A person can make this therapy evaluation process with the software as simple or as complicated as they want to make it.
I actually go for pretty simple.
It takes me longer to download my data into the software than it does for me to evaluate the data. I am happy with
"as long as I sleep well and feel decent.....I don't worry if things are maybe a little less than perfect"...but that's me.
For newbies...I usually suggest get a handle on understanding their leak reports and AHI and not worry about all the other stuff on the reports.
If leaks are good, AHI is good and a person is sleeping and resting well.... no need to even mess with the other stuff in the software.
_________________
| Machine: AirCurve™ 10 VAuto BiLevel Machine with HumidAir™ Heated Humidifier |
| Additional Comments: Mask Bleep Eclipse https://bleepsleep.com/the-eclipse/ |
I may have to RISE but I refuse to SHINE.
If you want to try the Eclipse mask and want a special promo code to get a little off the price...send me a private message.
If you want to try the Eclipse mask and want a special promo code to get a little off the price...send me a private message.
Re: mask leaks and trying to understand mine
Thanks!
_________________
| Mask: Quattro™ Air Full Face Mask with Headgear |
| Humidifier: S9™ Series H5i™ Heated Humidifier with Climate Control |
Re: mask leaks and trying to understand mine
Sorry I see numbers and statistics and I wanna tear them apart and look into them just because I can. I don't know but I am a freak like that pretty much like sheldon on big bang theory, but since I am butt a lowly electrician I don't get to do it much. Sorry I will try to keep the break downs to myself. I have been using the software for 3 1/2 weeks.
_________________
| Mask: Quattro™ Air Full Face Mask with Headgear |
| Humidifier: S9™ Series H5i™ Heated Humidifier with Climate Control |
| Additional Comments: apap 12-20 cm ; humidity 75° I have resscan 4.3 and sleepyhead |
Re: mask leaks and trying to understand mine
Impressive
_________________
| Mask: Quattro™ Air Full Face Mask with Headgear |
| Humidifier: S9™ Series H5i™ Heated Humidifier with Climate Control |
-
Jay Aitchsee

- Posts: 2936
- Joined: Sun May 22, 2011 12:47 pm
- Location: Southwest Florida
Re: mask leaks and trying to understand mine
Neallo, I think you are assuming your data points are evenly distributed, but they're not necessarily. Assume for a second you had only 20 data points instead of 480 and they were: 9 at 0.0, 2 at 15.4, 8 at 16.0, and 1 at 38.6. Your median would be 15.4 and your 95% would be 38.6 (Each data point represents 5% of the time). 45% of the time would be spent at 0.0, 10% would be spent at 15.4, 40% at 16.0, and 5% at 38.6.neallo wrote:Also, because my median is 15.4, that means I have 240 marks below that Mark, so now I have 216 between 15.4 and 38.6, which means that 45% I spend somewhere around 27L/min.
As Pugsy stated above, the most important things are, has your therapy been compromised by leaks above 24 L/min and have leaks of any size disturbed your sleep? A screen shot of your detailed graphs might be helpful.
_________________
| Mask: AirFit™ P10 Nasal Pillow CPAP Mask with Headgear |
| Additional Comments: S9 Auto, P10 mask, P=7.0, EPR3, ResScan 5.3, SleepyHead V1.B2, Windows 10, ZEO, CMS50F, Infrared Video |

Re: mask leaks and trying to understand mine
neallo,
For a nice introduction on how the median and the 95% are computed, see my blog entry: Average, Median, 95% numbers: A guide to those who don't remember their introductory stats
As Jay Aitchsee points out, you really can't find the 50% of a data set by taking the average of the lowest and highest numbers in the set. And when you write
To give you a concrete example. The following two data sets both contain 20 numbers, in both sets, the Median for the full set is 15.4 and the 95% is 38.6, but they have very different 70% and 75% numbers:
Data set 1: 0.0, 0.0, 0.0, 4.0, 4.0, 4.0, 8.0, 8.0, 9.0, 15.4, 15.4, 15.4, 15.4, 15.4, 15.4, 16.0, 25.0, 25.0, 38.6 38.6
Data set 1: 0.0, 0.0, 0.0, 4.0, 4.0, 4.0, 8.0, 8.0, 9.0, 15.4, 15.4, 25.0, 30.0, 38.6, 38.6, 38.6, 38.6, 38.6, 38.6 38.6
In both data sets, the 10th number on the list is in blue the 50% for the data: 50% of the data (the first ten numbers) are AT or BELOW that number. In both cases, the 50% is 15.4.
In both data sets, the 19th number on the list is in green and since 19/20 = .95, the green 38.6 is the 95% value for the set: 95% of the time the data is AT or BELOW 38.6 because the first 19 numbers are all AT or BELOW 38.6. The remaining 5% of the data (the 20th data point) has to be AT or ABOVE 38.6. So even though the 95% is 38.6, in this particular data set, 10% of the data lies AT or ABOVE 38.6.
The number in red on both lists is the 15th number in the data set. So the red number is the 75% for the data set since 15/20 = 75%.
In data set 1, the 75% is 15.4, and 75% of the data lies AT or ABOVE that number. The remaining 5 numbers on the list all have to be AT LEAST AS BIG as the 75% number. In this particular example, all the remaining 5 numbers are strictly greater than 15.4. So for 25% of the time, the data is AT or ABOVE 15.8, and actually for 25% of the time, the data is ABOVE 15.8.
In data set 2, the 75% is 38.6, and 75% of the data lies AT or ABOVE that number. The remaining 5 numbers on the list all have to be AT LEAST AS BIG as the 75% number. In this particular example, all the remaining 5 numbers are equal to 38.6. So for 25% of the time, the data is AT or ABOVE 38.6, and actually for 35% of the time, the data is EQUAL to 38.6.
If this were "leak data", Mr. Green Smiley would show up for Data Set 1 since the 70% for data set 1 is 9.0. And Mr Red Frowny would show up for Data Set 2 since the 70% for data set 2 is 38.6. (The 70% for each set is the 14th number in the set, and it is immediately before the number in RED.)
For a nice introduction on how the median and the 95% are computed, see my blog entry: Average, Median, 95% numbers: A guide to those who don't remember their introductory stats
As Jay Aitchsee points out, you really can't find the 50% of a data set by taking the average of the lowest and highest numbers in the set. And when you write
that's exactly what you are doing.So for an average 8hr night I have 24 readings at or above 38.6 and I have 456 readings below that Mark. Also, because my median is 15.4, that means I have 240 marks below that Mark, so now I have 216 between 15.4 and 38.6, which means that 45% I spend somewhere around 27L/min. That being the median between my true median and my 95%.
To give you a concrete example. The following two data sets both contain 20 numbers, in both sets, the Median for the full set is 15.4 and the 95% is 38.6, but they have very different 70% and 75% numbers:
Data set 1: 0.0, 0.0, 0.0, 4.0, 4.0, 4.0, 8.0, 8.0, 9.0, 15.4, 15.4, 15.4, 15.4, 15.4, 15.4, 16.0, 25.0, 25.0, 38.6 38.6
Data set 1: 0.0, 0.0, 0.0, 4.0, 4.0, 4.0, 8.0, 8.0, 9.0, 15.4, 15.4, 25.0, 30.0, 38.6, 38.6, 38.6, 38.6, 38.6, 38.6 38.6
In both data sets, the 10th number on the list is in blue the 50% for the data: 50% of the data (the first ten numbers) are AT or BELOW that number. In both cases, the 50% is 15.4.
In both data sets, the 19th number on the list is in green and since 19/20 = .95, the green 38.6 is the 95% value for the set: 95% of the time the data is AT or BELOW 38.6 because the first 19 numbers are all AT or BELOW 38.6. The remaining 5% of the data (the 20th data point) has to be AT or ABOVE 38.6. So even though the 95% is 38.6, in this particular data set, 10% of the data lies AT or ABOVE 38.6.
The number in red on both lists is the 15th number in the data set. So the red number is the 75% for the data set since 15/20 = 75%.
In data set 1, the 75% is 15.4, and 75% of the data lies AT or ABOVE that number. The remaining 5 numbers on the list all have to be AT LEAST AS BIG as the 75% number. In this particular example, all the remaining 5 numbers are strictly greater than 15.4. So for 25% of the time, the data is AT or ABOVE 15.8, and actually for 25% of the time, the data is ABOVE 15.8.
In data set 2, the 75% is 38.6, and 75% of the data lies AT or ABOVE that number. The remaining 5 numbers on the list all have to be AT LEAST AS BIG as the 75% number. In this particular example, all the remaining 5 numbers are equal to 38.6. So for 25% of the time, the data is AT or ABOVE 38.6, and actually for 35% of the time, the data is EQUAL to 38.6.
If this were "leak data", Mr. Green Smiley would show up for Data Set 1 since the 70% for data set 1 is 9.0. And Mr Red Frowny would show up for Data Set 2 since the 70% for data set 2 is 38.6. (The 70% for each set is the 14th number in the set, and it is immediately before the number in RED.)
_________________
| Machine: DreamStation BiPAP® Auto Machine |
| Mask: Swift™ FX Nasal Pillow CPAP Mask with Headgear |
| Additional Comments: PR System DreamStation and Humidifier. Max IPAP = 9, Min EPAP=4, Rise time setting = 3, minPS = 3, maxPS=5 |
-
Denial Dave

- Posts: 1335
- Joined: Wed Sep 19, 2012 6:45 am
- Location: Connecticut
Re: mask leaks and trying to understand mine
Robysue give you some excellent advice!!!
I noticed that your pressures are up there with me. I'm bi-pap 21 IPAP / 15 EPAP
Something to consider is that some of those higher spikes in leaks may simply be positional in nature. Check your charts and see how long they last. They may be coming when you roll over & the mask shifts and you get a quick spike in leaks.
Again, check your charts and see how long the spikes in leaks lasts
I'm a happy camper if my nightly 95% leak level is below 15 and really happy if it is below 10.
Dave
_________________
| Mask: Mirage Quattro™ Full Face CPAP Mask with Headgear |
| Humidifier: S9™ Series H5i™ Heated Humidifier with Climate Control |
| Additional Comments: Started at VPAP pressure setting of 20/14.4. I've survived Stage 1 cancer and lost 80+ lbs. Pressure is now 14.5 / 11 |
if you don't know where you are going... any road will take you there.... George Harrison
-
Becky at RemZzzs

- Posts: 40
- Joined: Wed Jun 20, 2012 3:15 pm
- Location: Jackson, MI
- Contact:
Re: mask leaks and trying to understand mine
Hi, neallo!neallo wrote:So I had been battling many mask leaks with my Quattro Air, but for little over a week now I haven't been waking up with leaks as much. But when I look at sleepyhead and resccan my leak graph looks crazy, but my median score is about 15.4, which means half time I am below this Mark and half time I am above this Mark. My 95% is a fluctuation between 38.6 and 58.9, All the posts I read tell me that I spend most of my sleep at or below that Mark, but doesn't that also mean that 5% of the time I am at or above that Mark. Meaning that in an eight hour night my machine takes 480 readings one per minute actually I think it takes 2880 readings one per second. So let's stay with the 480 readings, because it's scored on L/min. So for an average 8hr night I have 24 readings at or above 38.6 and I have 456 readings below that Mark. Also, because my median is 15.4, that means I have 240 marks below that Mark, so now I have 216 between 15.4 and 38.6, which means that 45% I spend somewhere around 27L/min. That being the median between my true median and my 95%. Now all this being said I spend roughly 75% of my time slightly above the large leak limit for my machine and below it. So would you understand that my leaks are under control or should I look for a new ffm? Or its everyone now confused and want to shoot me?
Also if I look at the little smiley face on my info screen when I wake up if it's happy and green that means I spent 70% below the large leak plateau combine all this information out means I had a good leak night, but if it is unhappy and red that doesn't mean I had s bad night just means my leaks were too big to compensate for but probably not too big to wake me Orr Dustin my sleep. Am I just putting to much into this? I have a mathematical mind and it wants to understand this information. From my understanding the key is the smiley face on the info screen
My name is Becky and I work for the company that makers the RemZzzs CPAP Mask Liners. I'm sorry that your are struggling a bit and have some pesky leaks, but I think that I might be able to help you! Our RemZzzs liners were designed to be a gasket between the mask and the face. RemZzzs can greatly decrease and usually eliminate positional leaks, which might be your main problem here.
I would love to send you a free 6 night sample of our RemZzzs CPAP Mask Liners at no cost or obligation to you. If you are interested, please feel free to PM me. If not, I completely understand and I won't bother you. But I do sincerely hope that you are able to conquer this issue!! :O)
~Becky at RemZzzs
Becky Bennett
RemZzzs Personal Customer Care Rep & Social Media Consultant
Naturs Design, Inc - the makers of RemZzzs
RemZzzs... Let yourself dream again
Prouldy Made in the USA
RemZzzs Personal Customer Care Rep & Social Media Consultant
Naturs Design, Inc - the makers of RemZzzs
RemZzzs... Let yourself dream again
Prouldy Made in the USA
Re: mask leaks and trying to understand mine
Sorry I have a terrible tendency to over think situations such as this. I have ADD and well when things pop into my mind I dwell on them for as long as I can, which leads to over thinking. I was just trying to figure out what these numbers mean. Basically how accurate are these numbers if they can be skewed heavily. Meaning if my 95% number was 38.6. But all other number was 0.0 with a max of 54.that means 24 minutes was spent in high leak area, but 7:36 spent at zero seems like a good night. I am trying to figure out how to get the graphs off of my phone and on a post here.
_________________
| Mask: Quattro™ Air Full Face Mask with Headgear |
| Humidifier: S9™ Series H5i™ Heated Humidifier with Climate Control |
| Additional Comments: apap 12-20 cm ; humidity 75° I have resscan 4.3 and sleepyhead |

Re: mask leaks and trying to understand mine
Pugsy wrote:Pugsy, would those Unknowns have been scored as real apneas if not for the high leak? Or is there no way of telling?neallo wrote:everyone now confused and want to shoot me?
This one.... Your math got me totally confused. I have no idea what your leak line graph might look like based on all those various data point things.
Assuming leaks don't wake a person up.....just look at ResScan and approximate how much time you actually see the leak line above the red line at 24 L/min.
Does it look like this? As ugly as this one was I still didn't get Mr Frowny face for large leaks more than 30% of the night...I was close though.
Personally, my thoughts....it depends on how far above 24 L/Min and how long it stays above 24 L/min. A couple of 15 minute blocks of time spent at 28 L/min isn't the end of the world. An hour or two up around 35 L/min...not good.
_________________
| Mask: Mirage Quattro™ Full Face CPAP Mask with Headgear |
| Humidifier: HumidAire H4i™ Heated Humidifier |
| Additional Comments: 14/8.4,PS=4, UMFF, 02@2L, |
"Do or Do Not-There Is No Try"-"Yoda"
"We are what we repeatedly do,so excellence
is not an act but a habit"-"Aristotle"
DEAR HUBBY BEGAN CPAP 9/2/08
"We are what we repeatedly do,so excellence
is not an act but a habit"-"Aristotle"
DEAR HUBBY BEGAN CPAP 9/2/08
Re: mask leaks and trying to understand mine
Oh....they were real apneas even now...just the machine didn't know whether to call the central or obstructive.Pugsy, would those Unknowns have been scored as real apneas if not for the high leak? Or is there no way of telling?
With the leak so bad the machine couldn't tell what kind of apnea but it was still an apnea of some sort.
The leak was not quite so bad as for the machine not to be able to sense anything at all and show a big blank spot where normally I would see a cluster of events that snuck past the defenses.
From my own past experience I have only had a rare occasion where the leaks go to bad that I went from yellow unknown apneas and leak got worse and I got a big blank spot and that was with the leak around 45 L/min.
I mention this because we often tell newbies if large leaks are present the machine's low AHI could be skewed by the big leaks and while this is true with massive leaks 40 L/min above...the machine does a decent job of at least sensing events and flagging them in leaks much bigger than a little 29 L/min leak. It really has to be a big, big leak for the machine to totally miss sensing any events.
29 L/min for 45 minutes is unlikely to be that big of a deal in terms of what the machine reports...it's not the end of the world if a person sleeps through it.
_________________
| Machine: AirCurve™ 10 VAuto BiLevel Machine with HumidAir™ Heated Humidifier |
| Additional Comments: Mask Bleep Eclipse https://bleepsleep.com/the-eclipse/ |
I may have to RISE but I refuse to SHINE.
If you want to try the Eclipse mask and want a special promo code to get a little off the price...send me a private message.
If you want to try the Eclipse mask and want a special promo code to get a little off the price...send me a private message.
Re: mask leaks and trying to understand mine
All statistical data can be skewed heavily by a few outliers. It's just the way stats works. The statistical numbers are accurate in the sense of being mathematically correct; the art of statistics is deciding when the outliers are genuinely skewing the data and when they are not.neallo wrote: Basically how accurate are these numbers if they can be skewed heavily.
The max leak rate can give a hint to whether the average (mean) leak rate is higher than expected because of an outlier's presence. If there's a big gap between the 95% number (38.6) and the max rate (54), that usually indicates the mathematical mean (the average) may be inflated due to the outlier max rate data. But the overall meaning of the 95% is still the same and not influenced by the max leak rate at all.Meaning if my 95% number was 38.6. But all other number was 0.0 with a max of 54.that means 24 minutes was spent in high leak area, but 7:36 spent at zero seems like a good night.
With a 95% leak rate of 38.6, you were leaking AT or ABOVE 38.6 L/min for at least 5% of the night, and that means you were leaking ABOVE the read line for at least 5% of the night and maybe a whole lot more. What was the median leak rate? When you say "all other number was 0.0", do you mean the median leak rate was 0.0? If the median leak rate was 0.0, then we know you were not leaking at all for at least 50% of the night and you were leaking very badly for at least 5% of the night. What was going on during the remaining 45% of the night cannot be inferred from the median and 95% leak rate data.
If Mr. Green Smiley showed up, we know that you were leaking very badly for at least 5% of the night, but your leak rate was acceptably low (below 24 L/min) for at least 70% of the night. So if Mr. Green Smiley showed up, you were in Large Leak territory for at least 5% of the night, but not more than 30% of the night.
If Mr Red Frowny showed up, we know that you were not leaking at all for 50% of the night (because the median leak rate is 0.0), but you were also in large leak territory for at least 30% of the night.
Here's are some instructions pugsy wrote a while back:I am trying to figure out how to get the graphs off of my phone and on a post here.
pugsy wrote:Open the image to full size so it is easily read.
I use Vista snipping tool to create a screen shot and crop the image at the same time.
Prt/scr key will also take a screen shot if using XP. If laptop is used sometimes the Fn key has to be pushed at the same time as the prt/scr key
I think windows 7 Home Premium has the snipping tool, Basic may not.
Once the screen shot is created save it in jpg format.
Upload the image to a host site. I use Photobucket it is free, there are others.
Once the image is uploaded then copy the ENTIRE IMG address. Be sure to include the opening and closing IMG in brackets. Paste that copied address into a post here.
If you want to use Photobucket they provide a box with the various url addresses and you just choose the last one in the box.
Copy/paste that last line url address into the body of your post.
Use the preview button. If you can't see the image try again because if you can't see it we can't.
_________________
| Machine: DreamStation BiPAP® Auto Machine |
| Mask: Swift™ FX Nasal Pillow CPAP Mask with Headgear |
| Additional Comments: PR System DreamStation and Humidifier. Max IPAP = 9, Min EPAP=4, Rise time setting = 3, minPS = 3, maxPS=5 |