I was diagnosed in late November with Very Severe OSA and my
sleep study AHI was 130 events per hour. I have responded very well to xpap therapy with a daily AHI ranging between 0.5 to 1.5 events per hour. I do feel better, sleep soundly through the night and BR breaks have dropped by 5 per night down to 1 or none. However, I do have days that I'm still tired and wondering if I'm receiving all the possible benefits from therapy. Yes, I do understand other factors can cause one to be tired... My flow limitation chart does not look very good, suggesting that their is still some limitation in flow. I was wondering if others would be willing to share their flow limitation charts and sleep study AHI's. Perhaps those of us with very high initial AHI do not have fully resolved flow limitation graphs but those will lower sleep study AHI have fully resolved flow limitations. Post your data and let's see if there is a correlation!
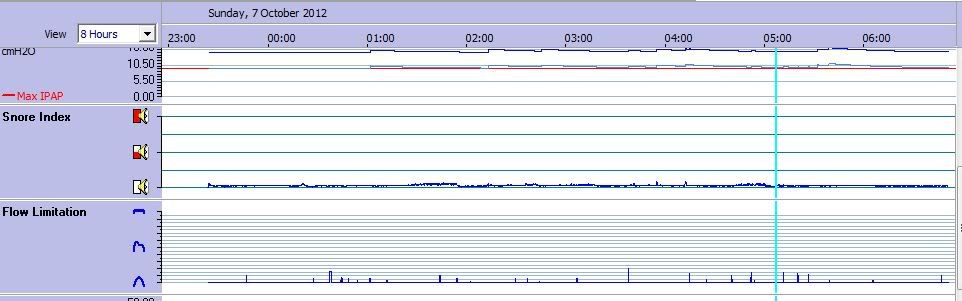
Here is my flow limitation graph with machine settings of: cpap mode, 17.6 cm pressure, EPR=2, 10 minute ramp from 12 cm at start up
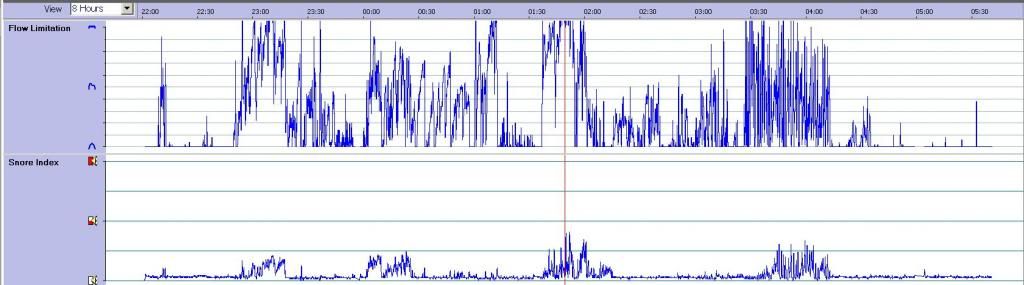
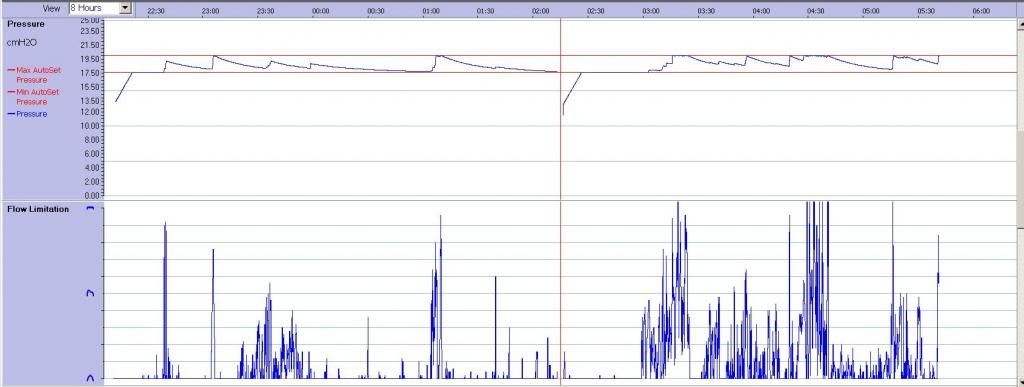
Here is my flow limitation graph with machine settings of: apap mode, 17.6 to 10 cm pressure, EPR=2, 10 minute ramp from 12 cm at start up
Post your flow limitation graphs, I wanna see if mine are typical or really poor for successful therapy.