

I know there is a lot of confusion even in the medical community about UARS. Is it a form of OSA or a syndrome all to itself? Can it be treated with CPAP or should a dental device be used? I really don't care so much about all that academia; what I care most about is getting better and while on that journey posting my findings and progress so that others may benefit as well. To that end, that is why I am posting today.
It seems the APAP machines are designed primarily for OSA patients, in that, in the end they are attempting to apply an air stint to keep the airway open and to preemptively prevent apnea/hypopnea events from occurring. The end result being more uniform sleep architecture and a better rested patient. However, individuals who exhibit high frequencies of RERAs do not necessarily see many apnea or hypopnea events. There are many theories for this, the most notable that I have seen is that UARS patients have a more sensitive nervous systems and exhibit an arousal earlier in the cycle before the apnea/hypopnea event can occur. This usually results in oxygen desaturation that is not as low as that which occurs with apnea/hypopnea events. In my sleep study my desats never when below 91%, for example.
Back to the APAP machine, what I have observed is that the ResMed AutoSet increases pressure for flow limits, snores, hypopneas, and obstructive apneas. In my experience so far, the apnea/hypopnea events and major snores result in the most dramatic increases in pressure while flow limits and mild snoring result in very minor increases in pressure (usually around .25cm to.50cm). Since flow limitation is believed to be the precursor to a RERA, it is the basis of my former statement that (at least my) APAP machine seems to be optimized more for the treatment of OSA than UARS and probably for good reasons (that I won't go into here).
Because my condition concerns a high frequency of RERAs I have focused my energy on flow limitation. Inspiratory flow limitation reveals itself in the Flow Rate graph as a non-rounded shape to the upper half of the flow rate sine wave. I do not know how the ResMed algorithm calculates flow limit, only that it scores it on a scale of 0.0 to 1.0. It seems to be doing this on a range of respiratory cycles since flow limitation can be seen on a breath by breath basis with no or very minor change in the flow limit graph.
Now onto my personal observations over the last 11 days on the machine. The following graphs are typical. These patterns exist on every single day of my treatment thus far. While I can find exceptions to these patterns, they represent the majority of respiratory behavior at the given pressure.
Since we are working outside of insurance, my sleep doctor is using the APAP to dial in the pressure by using a rather wide range of 5cm to 15cm. Look at these first two graphs. They are typical of what I see when my pressure has dropped back down to the minimum area around 5cm. Notice the shapes of the tops of the inspiratory curves:
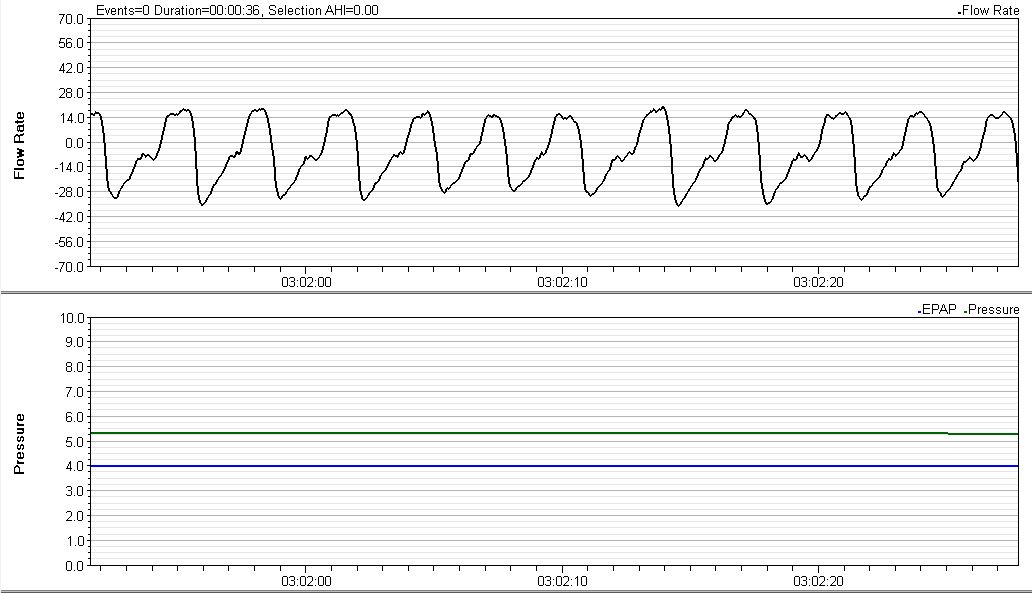
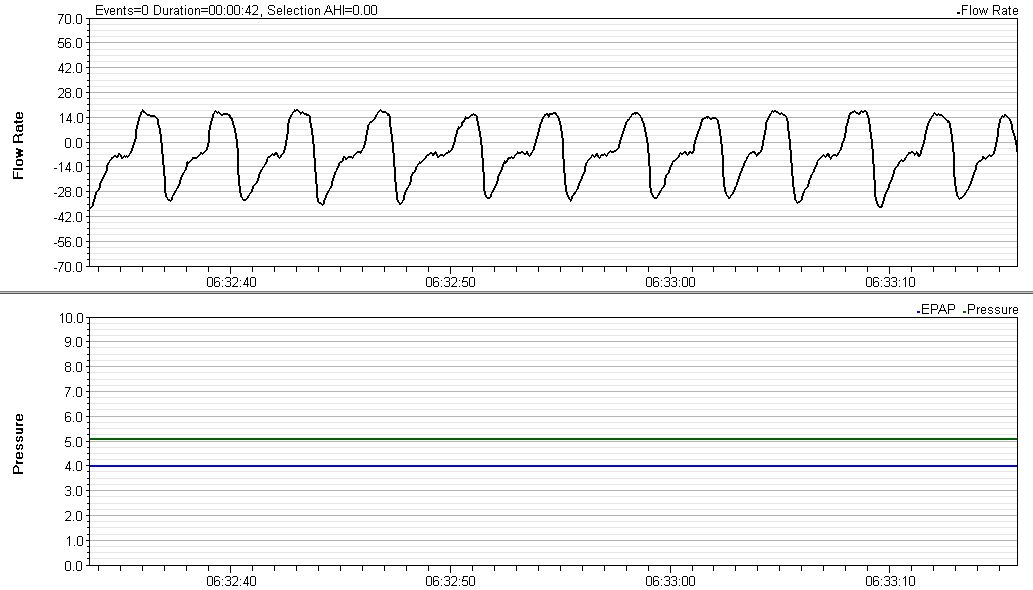
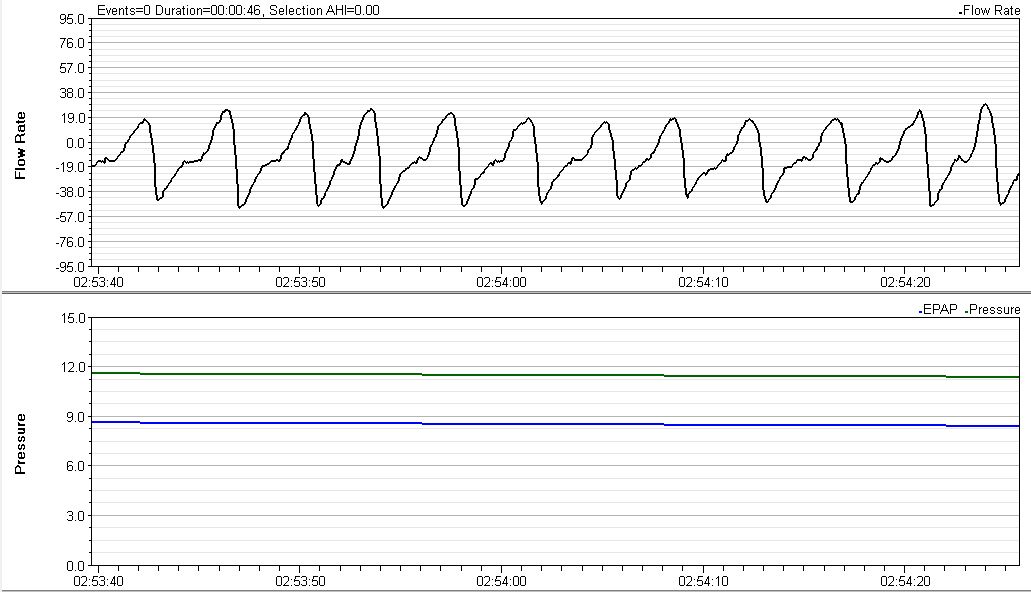
Compare those graphs to the next two where due to flow limits and/or apneic events the pressure was raised to around 7cm:
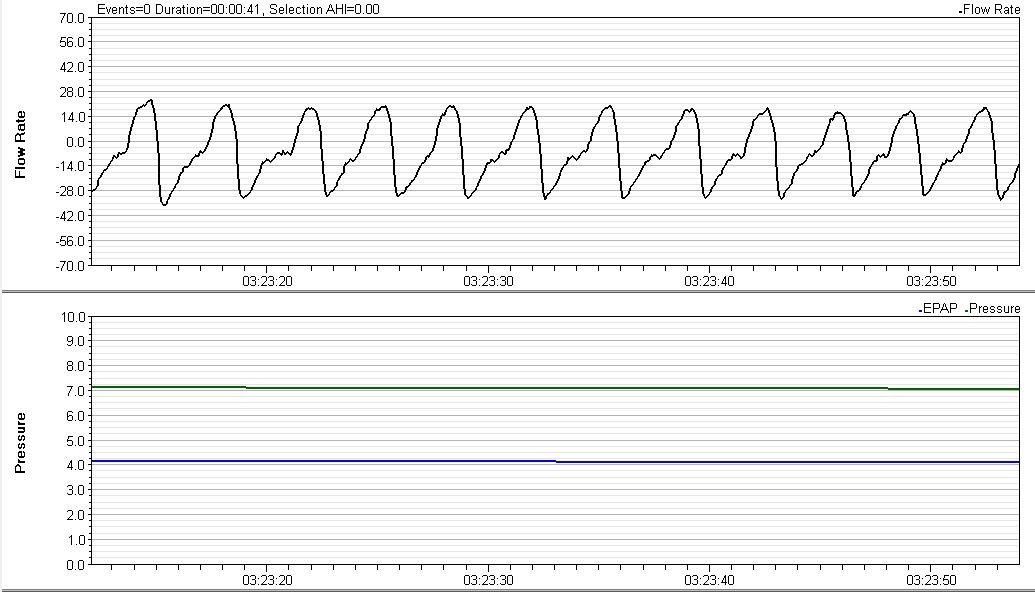
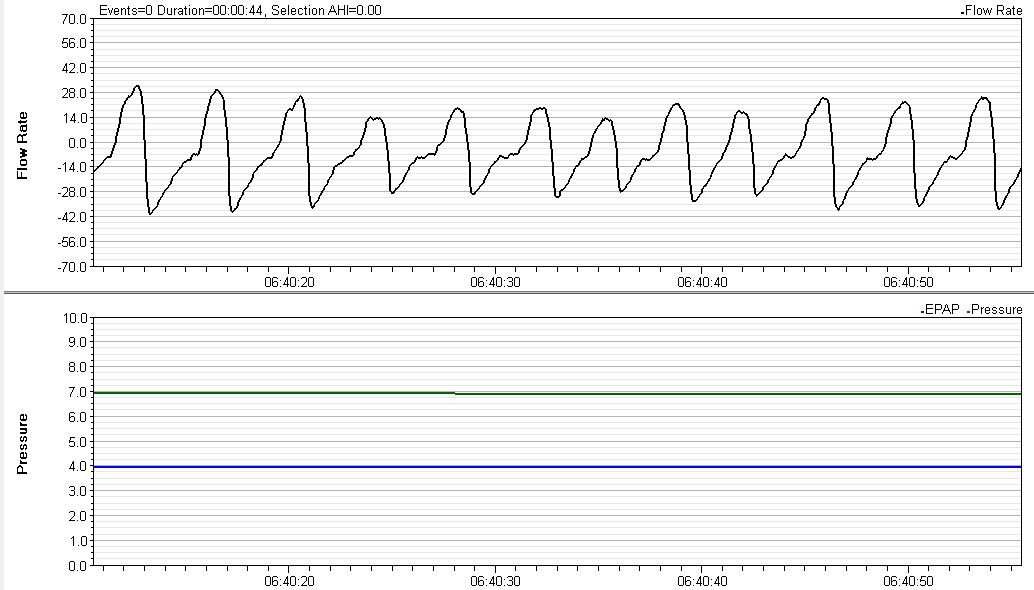
The 7cm curves are more sinusoidal and exhibit less erratic noise than those on the 5cm curves. What a difference a couple of cm's makes!
Also note this graph where I had an OA following by a rather significant snore resulting in my pressure approaching 12cm:
If we assert that rounding out the tops of the inspiratory curve does in fact correlate with reduction or elimination of flow limitation (there is plenty of literature backing up this assertion) and flow limitations lead to RERAs in UARS patients then it seems that a higher minimum pressure will work for me. I can further conclude that my pressure requirements should not be relatively high. This is good news since it means I may be able to continue treatment with the APAP without having to result to needing a BiPAP.
I also would like to share something I learned along the way looking at these graphs. Initially I thought that inspiration started at the bottom of the curve and ended at the top of the curve with expiration being the other half (from top to bottom). With this false understanding I never understood why I saw that brief pause in the middle of what I thought was inspiration. The lights came on when I realized these are rate graphs. As long as the value being graphed is above zero is represents inspiration. Whenever the value drops below zero (goes negative) it represents expiration. This is significant to the understanding of flow limitation since the non rounding of the tops of the curve represents that moment in the respiratory process when the rate of flow is at its maximum.
I am interested in your thoughts. If I have overstated the obvious or made any blunders please forgive and/or correct me. I admit that I am new to this whole thing, but it has become a very exciting journey so far!
Based on my understanding, I am considering raising my minimum pressure by 1cm per week until I see the majority of these flow rate graphs rounding out at minimum pressure. However, since I am still acclimating myself to having an alien on my face all night, I may delay those changes for a week or more.